
Kindle Vella Top 250 Faved List Breakdown (January 2022)
The Data
The data logged in this article was manually gathered [February 1st 2022] from the Kindle Vella Top 250 Faved list from information publicly available at the time this article was written. Please be advised the data and insights provided are the opinions of Book Genie. We make no warranty or guarantee regarding the correctness or authenticity of the data, as these are informal calculations gathered via our independent research and is in no way affiliated with or should be construed to represent Amazon, Kindle Vella, or any other Amazon entity.
None of the authors, contributors, administrators, owners, or anyone else connected with Book Genie, in any way whatsoever, can be responsible or liable for your use, reliance, or distribution of the information contained in or linked from these web pages. We respectfully remind readers that we assume no responsibility or liability for any errors or omissions in the content of this data. The information contained here is provided for general informational purposes only on an "as is" basis with no guarantees of completeness, accuracy, usefulness or timeliness. Percentages listed may be rounded.
Series Genre Distribution in the Top 250 Faved List
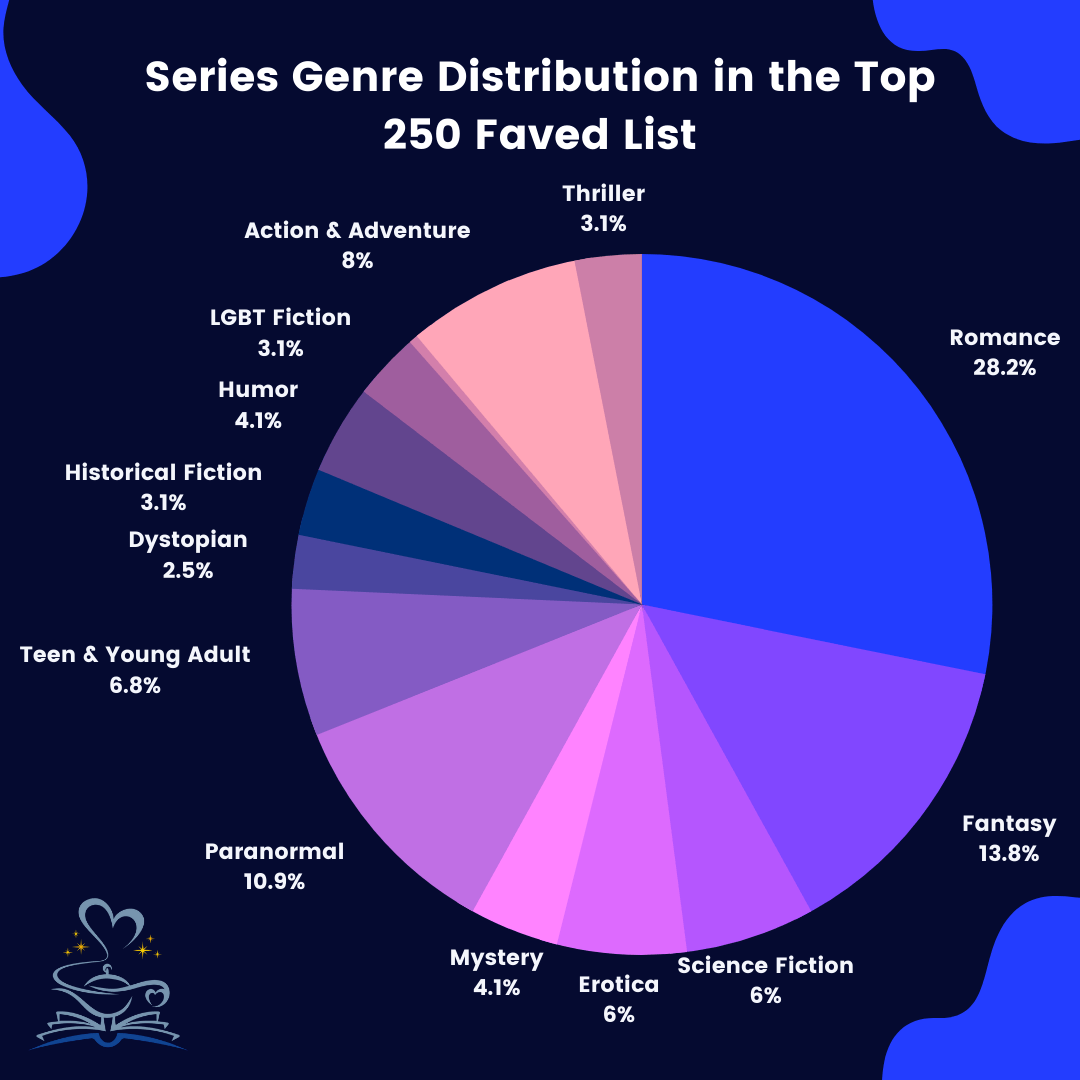
The first chart displays the most frequently occurring genres in the top 250 Faved list on Kindle Vella. We determined these numbers by relying on the genre designations (both primary and secondary categories) for each series. For example, if a series is listed as dystopian and paranormal, that series was counted once in dystopian and once in paranormal. The author's story "tags" were not factored into this analysis.
Month/Month Comparison

This month I’ve added a few new sections to the report due to author interest. Continuing to explore the distribution of Genres (both primary and secondary categories) in the top 250 list I’ve added a Month/Month comparison to display the changes in occurrence from December to January.
Series Marked as Complete
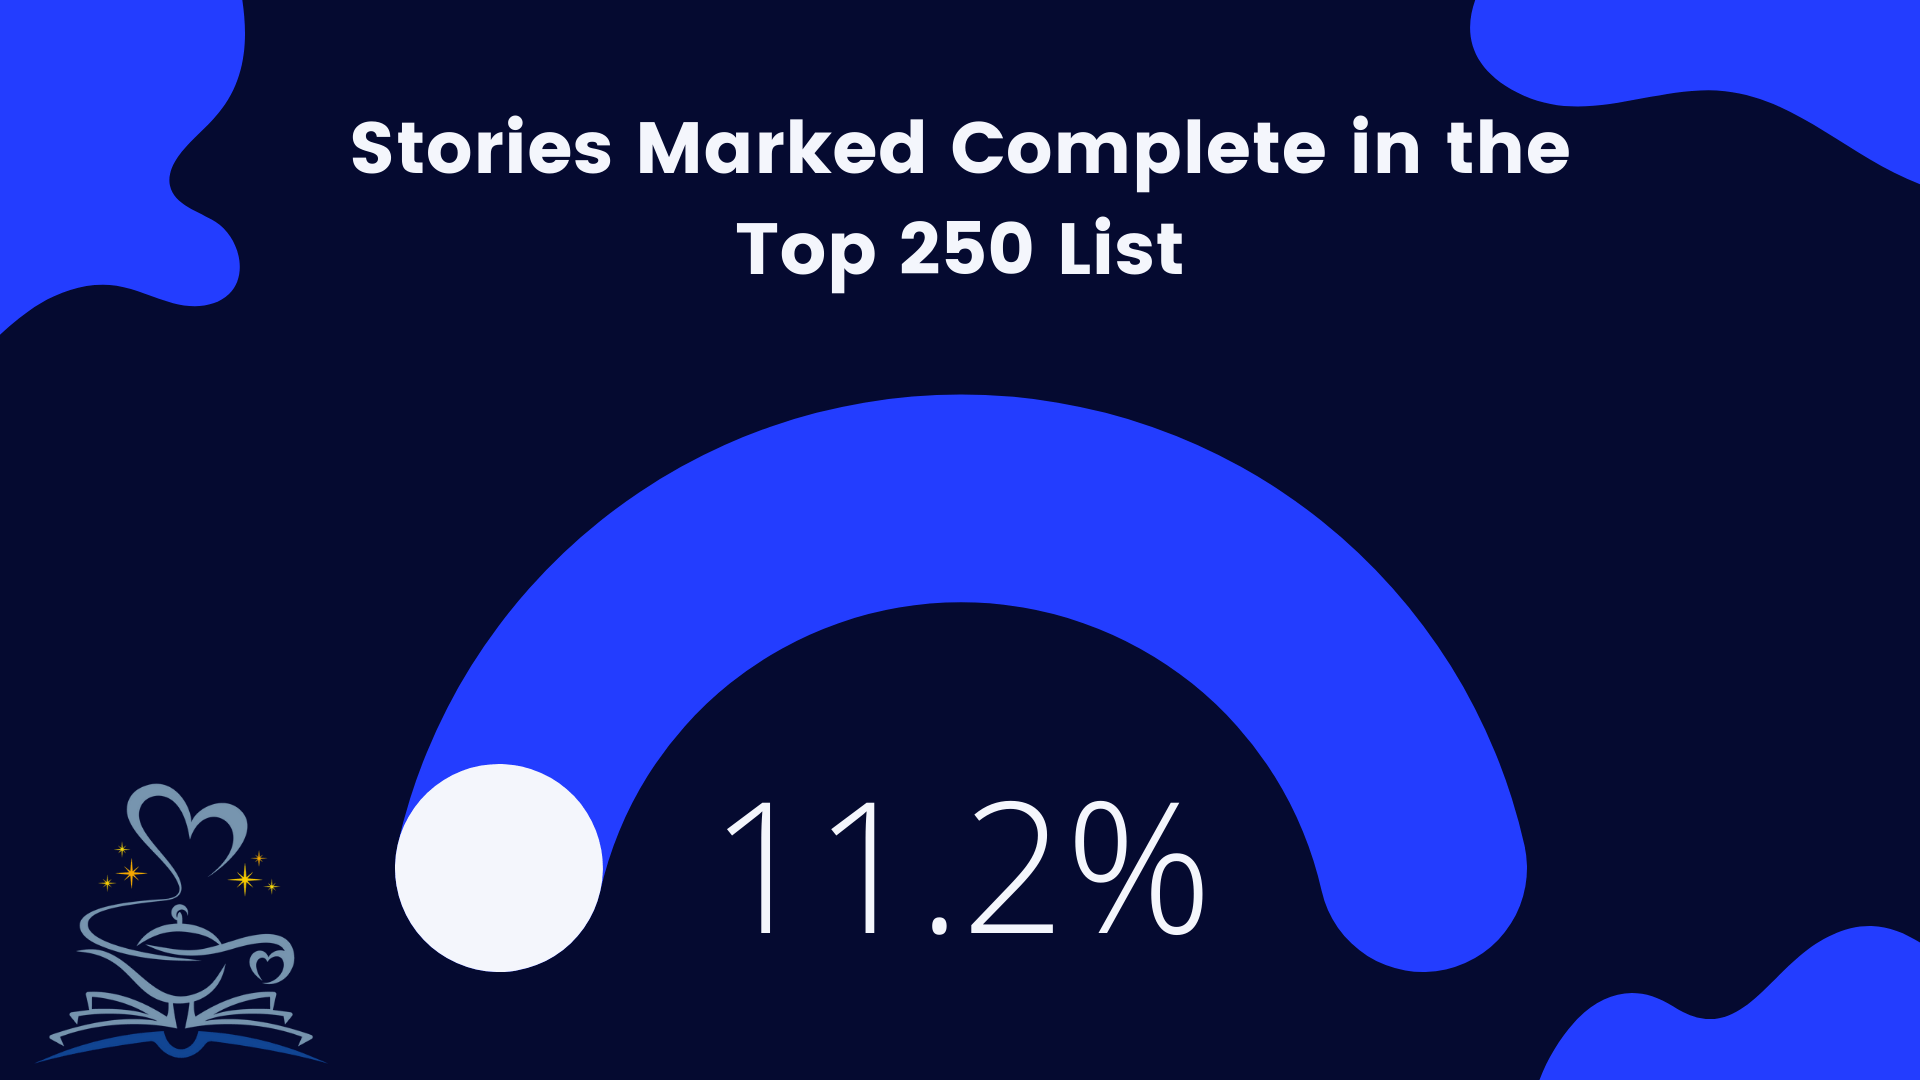
This section of the report “Series marked complete” tracks the percentage of series that finished this month in the top 250 list that had labeled themselves with the Completed marker available in the Vella dashboard. In December we saw a total of 33 (13.2%) series marked complete finish in the top 250. However, in January the number of completed series ranked in the Top 250 has reduced to 28 (11.2%).
Series Likes per published episode - Month/Month comparison

Likes per episode is one method by which authors can evaluate the performance of a series. Authors can use this data to set goals, make projections, and evaluate their series relative to similar series.
In the chart above I have recorded the likes per episode for each series and once again assigned the results to both the primary and secondary genre designations.
While there are many factors that can indicate how a series is performing (unlocked episodes, story follows, etc.) authors can use episode likes to gauge the relative "engagement" of their readers, since likes are a very visible way authors can see that in fact a reader "engaged" with the episode.
While this might be overwhelming news for authors with a small number of overall episodes likes, there is good news. Dividing the likes a series has by its number of published episodes provides an average like per episode. If you compare a 100 episode series to a 10 episode series, a small series may have the same ratio of published episodes to likes.
For example, a series with 100 published episodes and 50 likes has the same "relative engagement" as a series with 10 published episodes and only 5 likes. While the goal of every author is to grow likes and paid episode unlocks, the average number of likes per episode can be a great way to see the performance of your series relative to a series with much larger numbers.
This month I once again have added a comparison to the previous month. In so doing we are able to spot growth or decline in engagement by genres.
Average Series Likes - Month/Month Comparison

In the next series of charts including the one above I wanted to compare series ranked on the top 250 List. For this analysis, I've created an average of the total likes in groups of 25. The reason for this is the current page view on Vella indexes series on the Top 250 List in groups of 25 per page.
The above chart shows the average number of likes each series has accumulated over the total numbers of published episodes for each group (page). In addition I’ve added to the chart December’s results for comparison.
So the series that rank between 1 and 25 on the Top Fave list average 7859 likes per series.
Average Series Likes/Episode - Month/Month Comparison
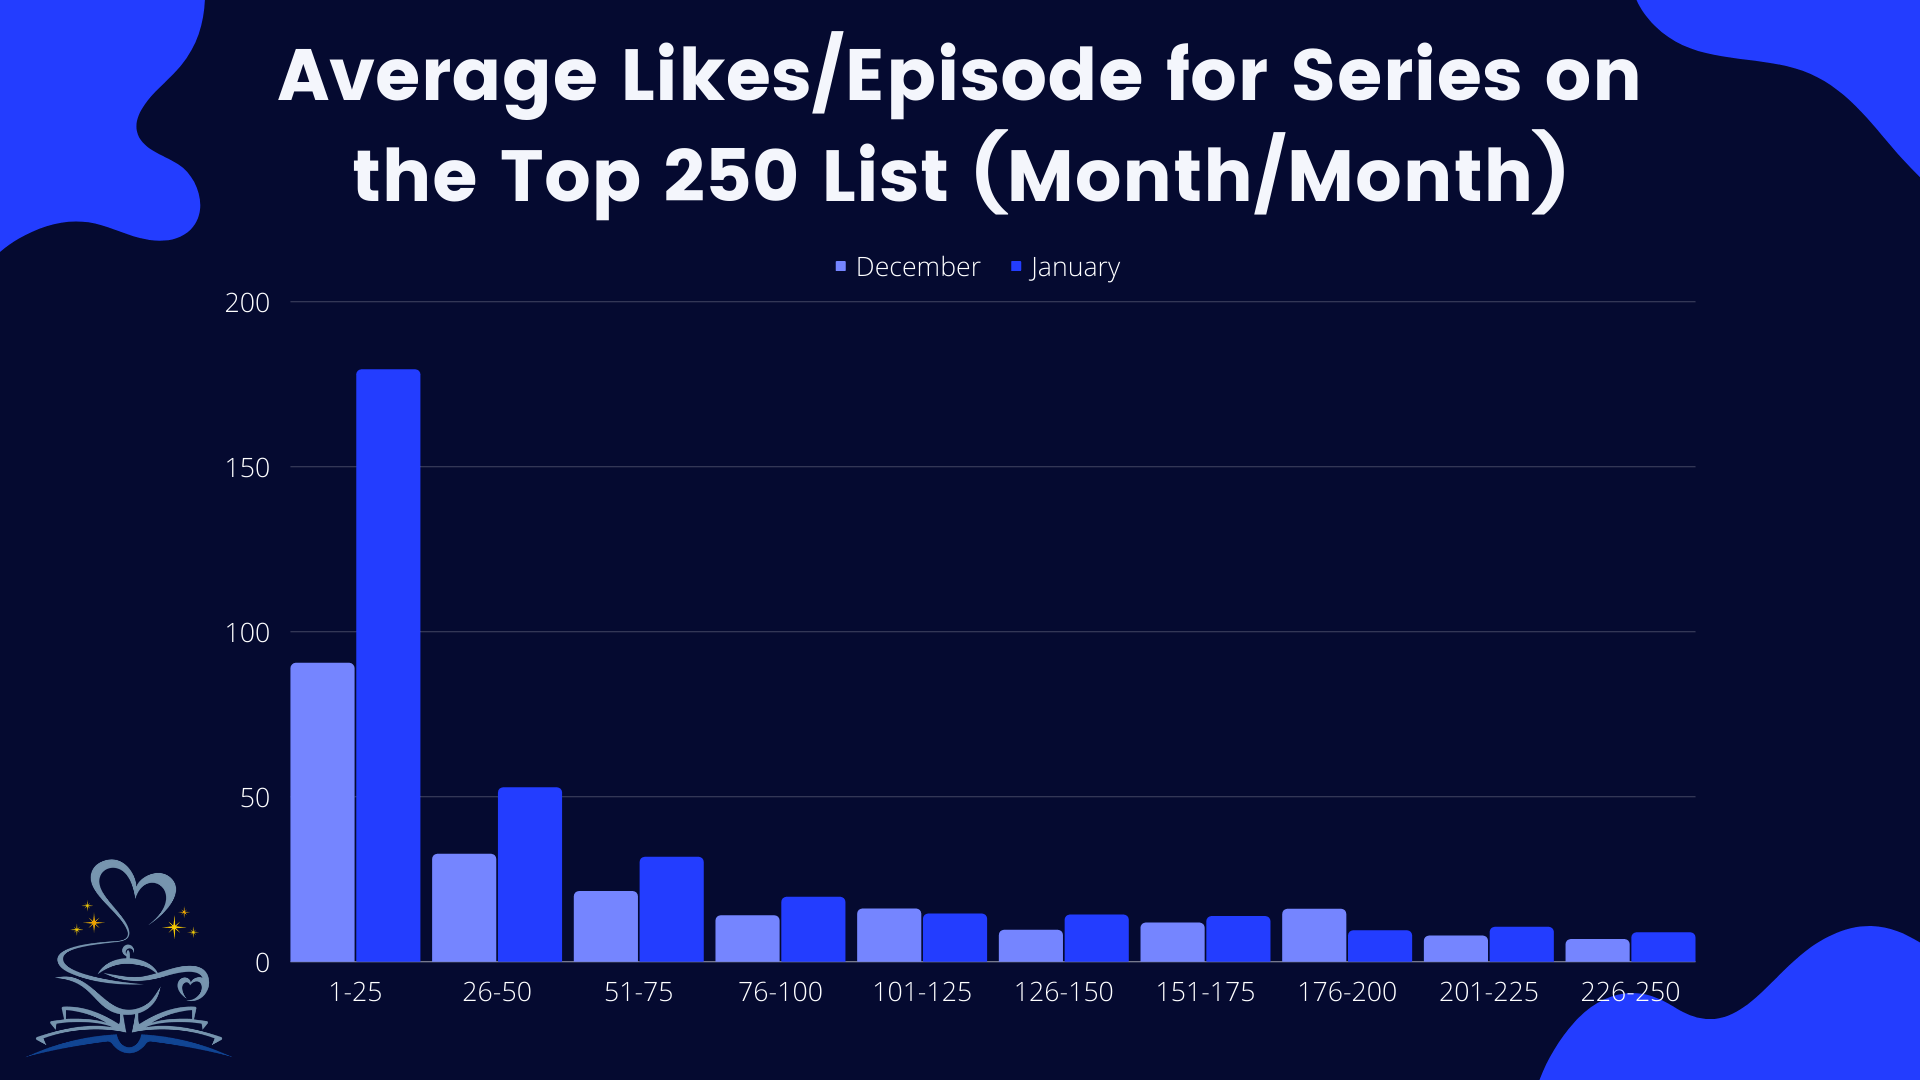
Like the previous chart, the chart above groups series by their position on the top 250 Fave List again per page view, 1-25, 26-50, and so on. This chart provides the average number of likes that an episode has received for series bundled per page view, 1-25, 26-50, and so on. So for example, series that rank between 1-25 on the Faved List averaged 179 likes per episode. Again I’ve added December's results for comparison.
Publishing Frequency Distribution in the Top 250 Faved

The above chart displays the distribution of publishing frequencies in the top 250 Faved List on Kindle Vella. For this chart series marked complete were excluded.
Publishing Frequencies of the Top 25 Series
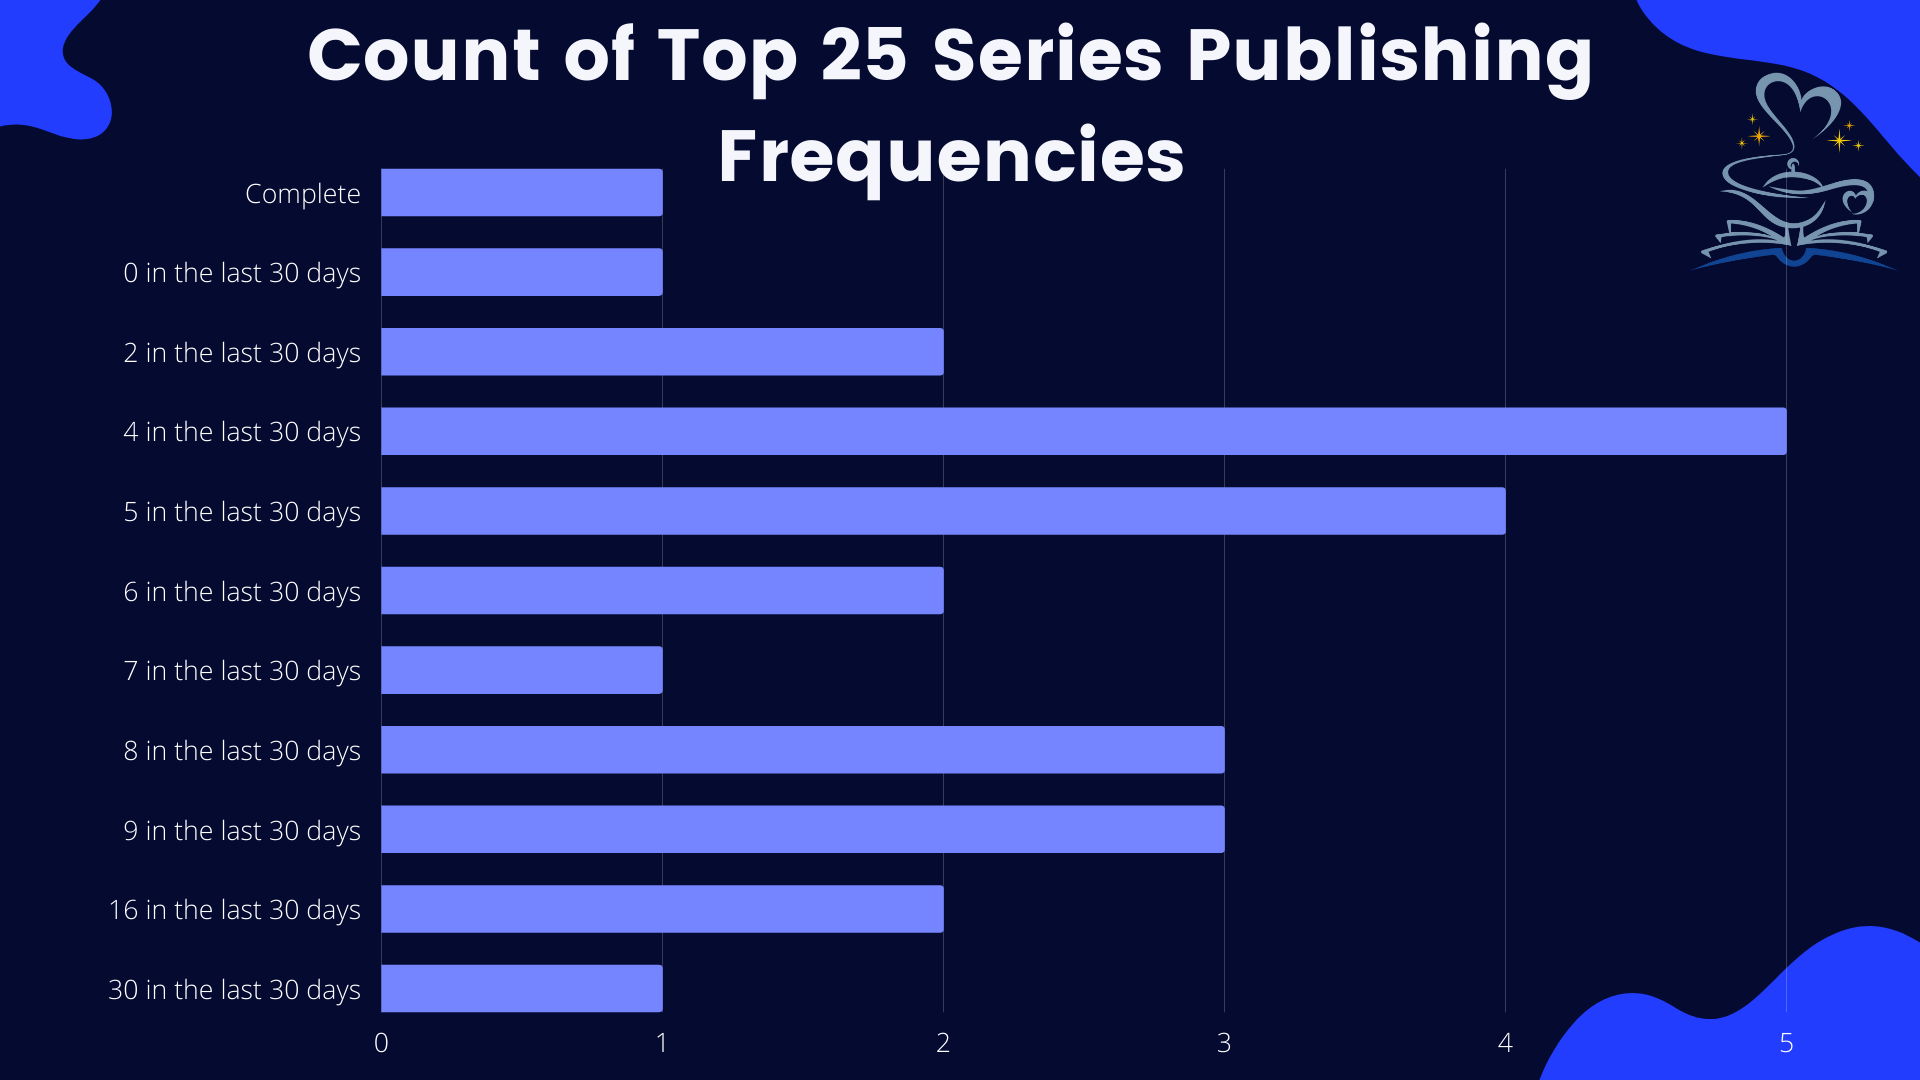
Finally, the above chart looks at the distribution of publishing frequencies and counts publishing frequency within only the top 25 series on Kindle Vella (as opposed to the above which includes the entire 250 Tope Faved List).
Conclusions
Once a week is the most common of release schedules.
As we can see from both reports on publishing frequency the most commonly occurring publishing frequency was “4 in the last 30 days” with both 3 & 5 performing high too. This publishing frequency closely tracks with a once per week publishing schedule.
However, it should be noted that publishing frequency does not seem to factor into how high a series can rank on the top 250 list. The top 25 series show a wide range of publishing frequencies. Authors should use once per week as a rough guide for what is common on Vella.
The platform is growing!
As we can see from graphs plotting likes per episode, we can see across the board significant increases in the engagement per episode regardless of genre. This would signal that either the ability/incentive for readers to engage has increased or that the volume of readers that are contributing to reads has increased. The latter of which I believe to be the case due to recent updates from Amazon, the addition to both Android and various Kindle devices, and finally monetary incentives being sent through push notifications to Kindle app users.
Romance remains dominant.
As we can see from the genre distribution reports there appears to be very little shift in the percentage of genres that finish in the top 250 Faved List, with Romance remaining the significant leader.