
Kindle Vella Top 250 Faved Breakdown (February 2022)
The data logged in this article was manually gathered [March 1st, 2022] from the Kindle Vella Top 250 Faved list from information publicly available at the time this article was written. Please be advised the data and insights provided are the opinions of Book Genie. We make no warranty or guarantee regarding the correctness or authenticity of the data, as these are informal calculations gathered via our independent research and is in no way affiliated with or should be construed to represent Amazon, Kindle Vella, or any other Amazon entity.
None of the authors, contributors, administrators, owners, or anyone else connected with Book Genie, in any way whatsoever, can be responsible or liable for your use, reliance, or distribution of the information contained in or linked from these web pages. We respectfully remind readers that we assume no responsibility or liability for any errors or omissions in the content of this data. The information contained here is provided for general informational purposes only on an "as is" basis with no guarantees of completeness, accuracy, usefulness or timeliness. Percentages listed may be rounded.
% Occurrence in 250 Top Faved List
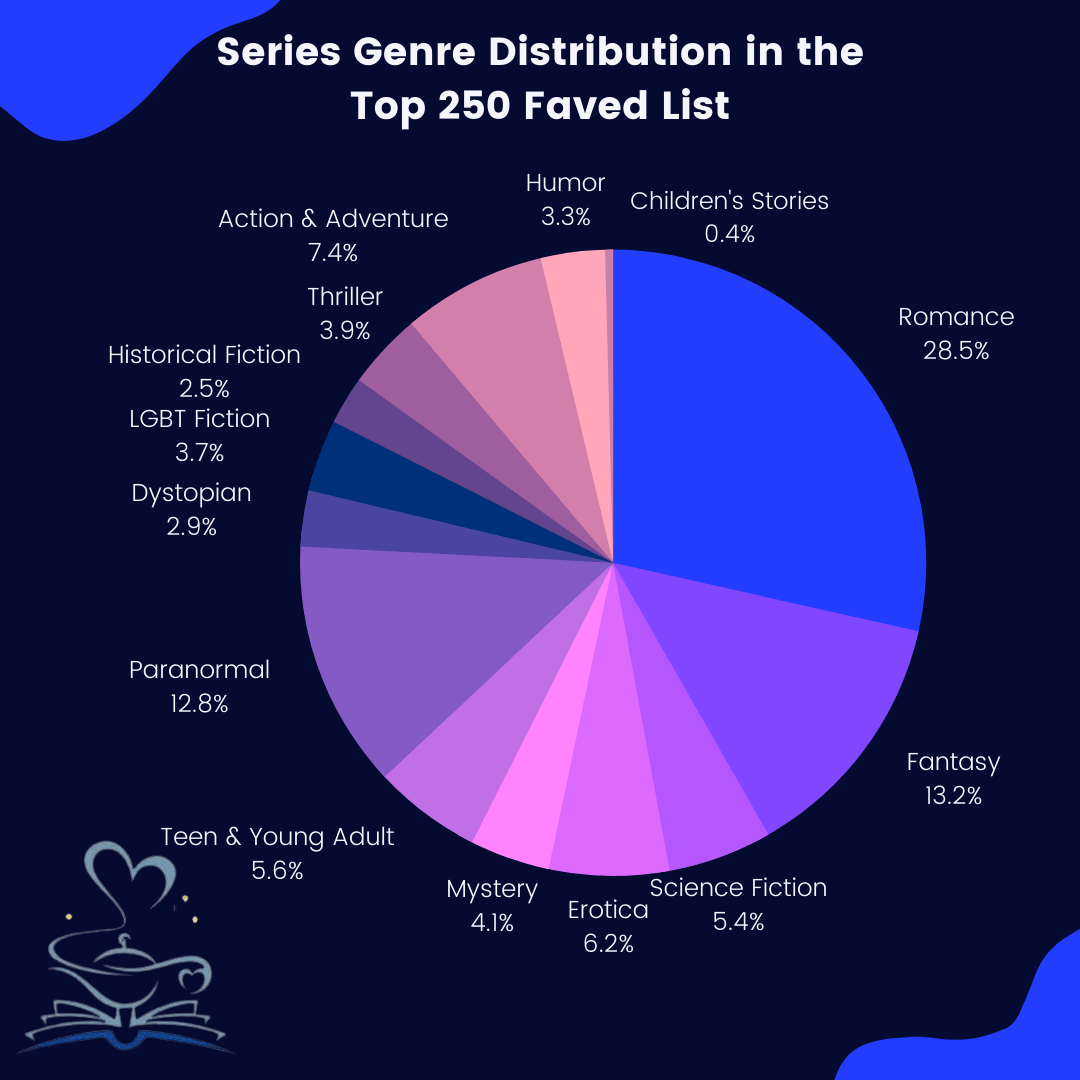
The first chart displays the most frequently occurring genres in the top 250 Faved list on Kindle Vella. We determined these numbers by relying on the genre designations (both primary and secondary categories) for each series. For example, if a series is listed as dystopian and paranormal, that series was counted once in dystopian and once in paranormal. The author's story "tags" were not factored into this analysis.
Month/Month Comparison - Count of Genre Occurrence on the Top 250 Faved List
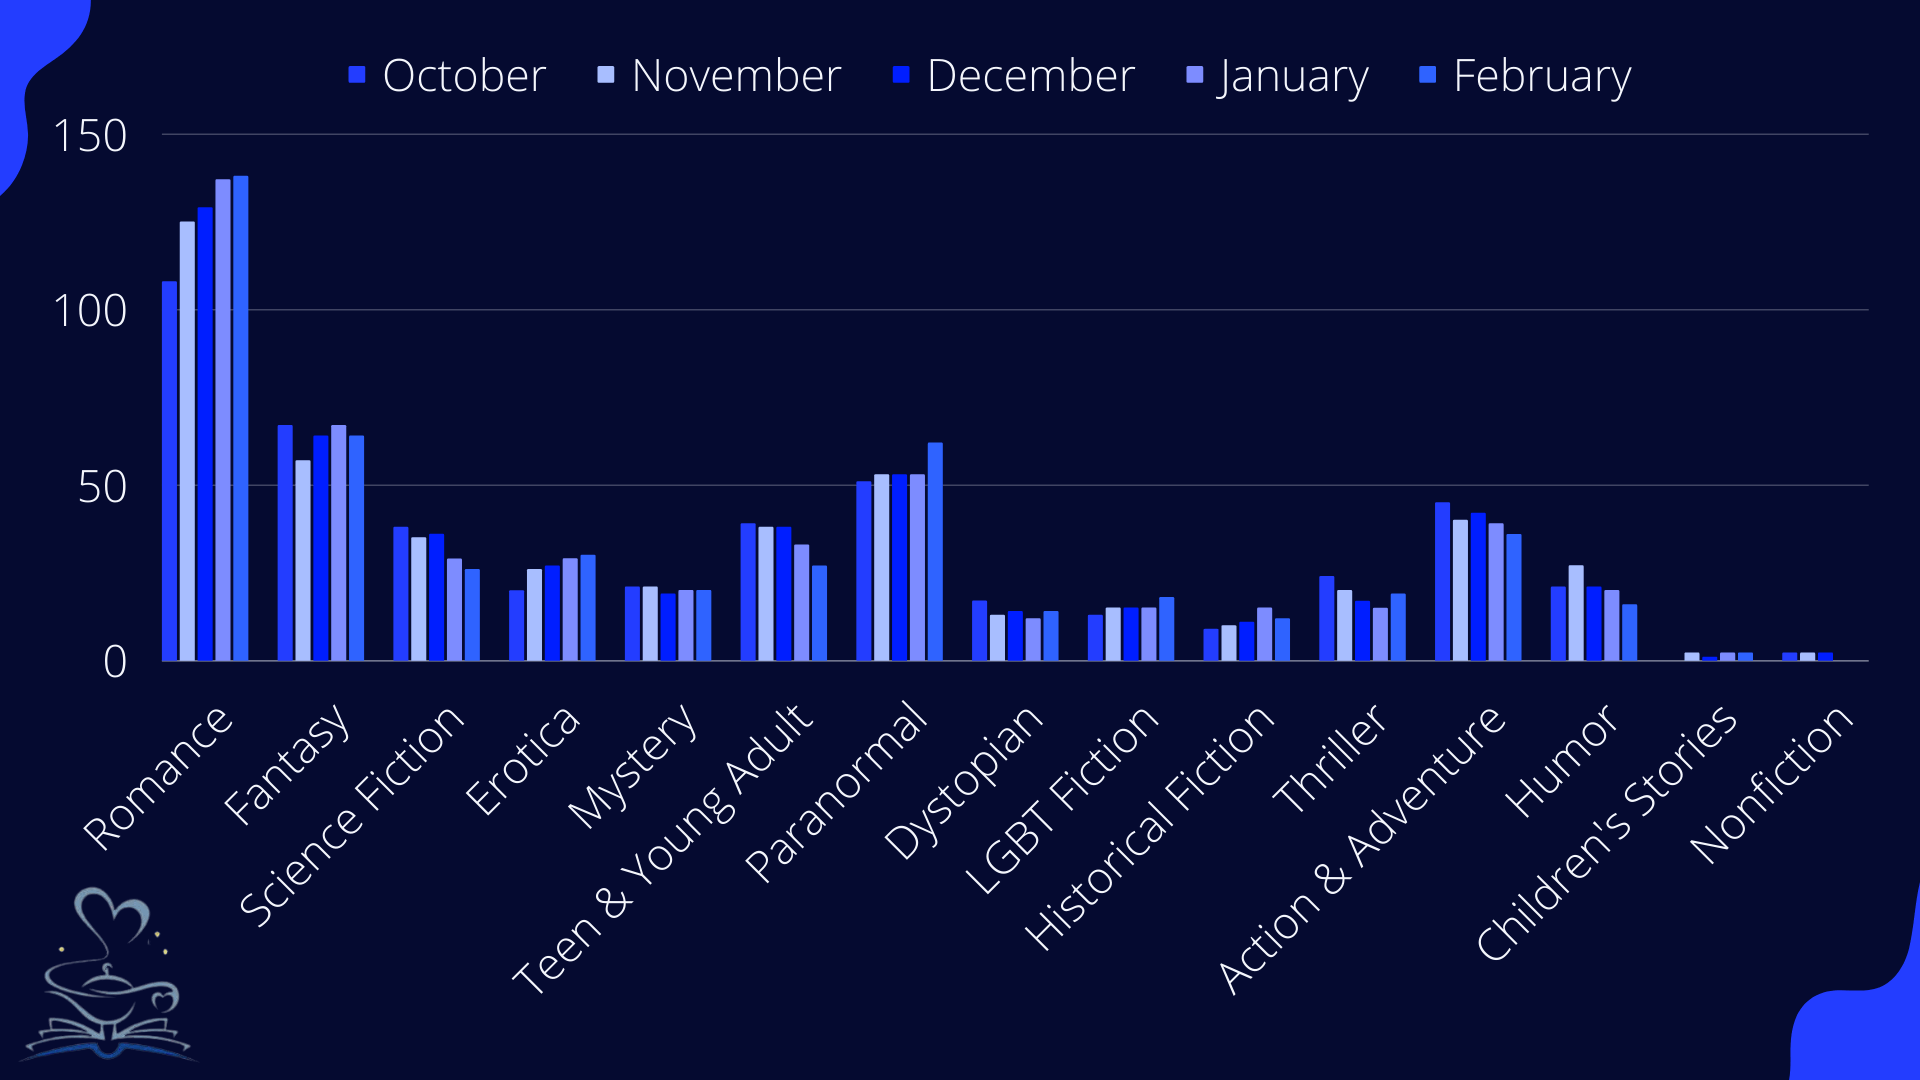
Continuing to explore the distribution of Genres (both primary and secondary categories) in the Top 250 Faved List I’ve added a Month/Month comparison to display the changes in occurrence from October (2021) to February (2022).
Series Marked as Complete
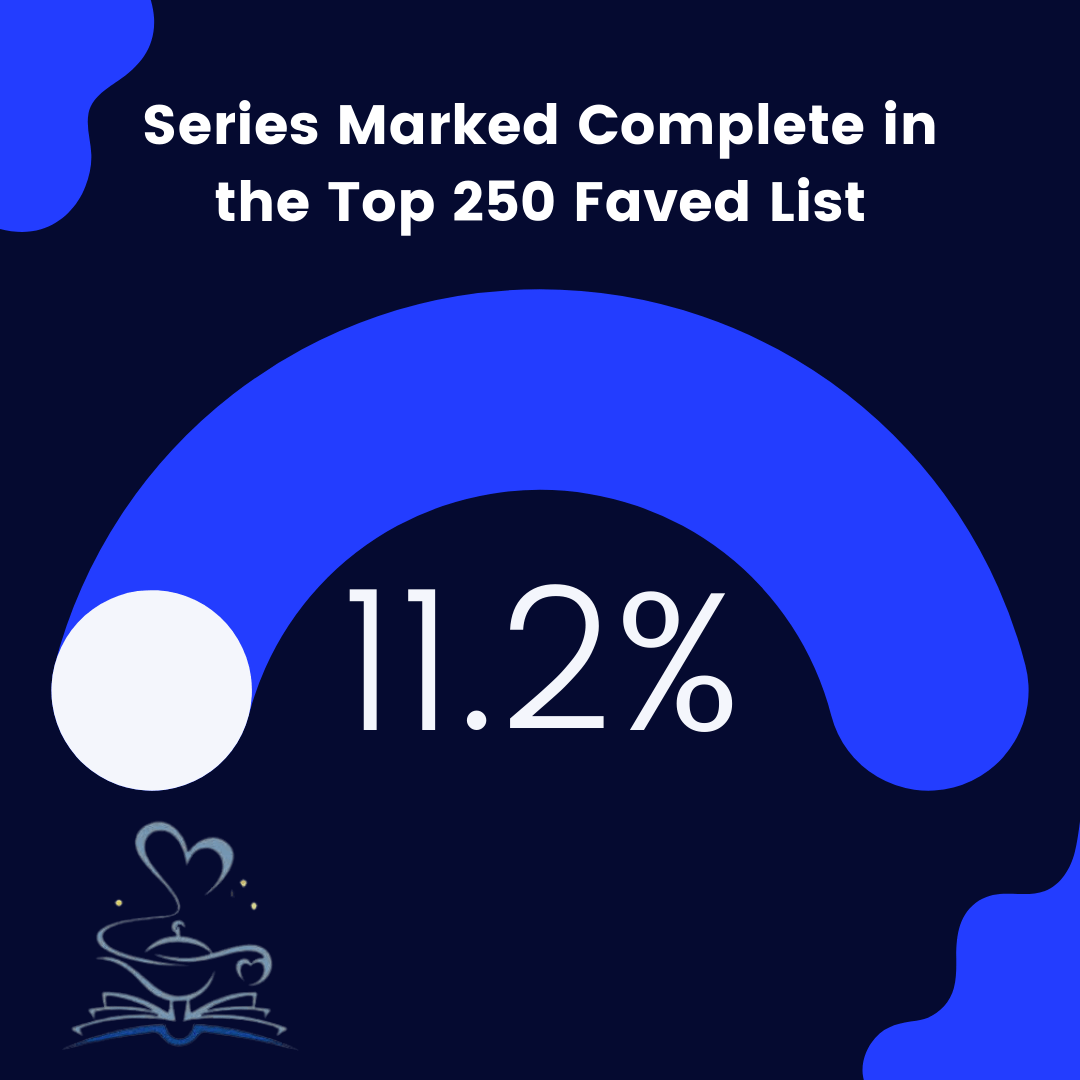
This section of the report “Series Marked Complete” tracks the percentage of series that finished this month on the Top 250 List that were labeled Complete (using the marker available in the Vella dashboard). In December, 33 (13.2%) series marked complete ranked on the Top 250 Faved List. In January, the number of completed series ranked on the Top 250 Faved List reduced to 28 (11.2%). In February, we can observe the same number of completed series (28) in the Top 250.
Average Series Likes Per Published Episode - Month/Month Comparison
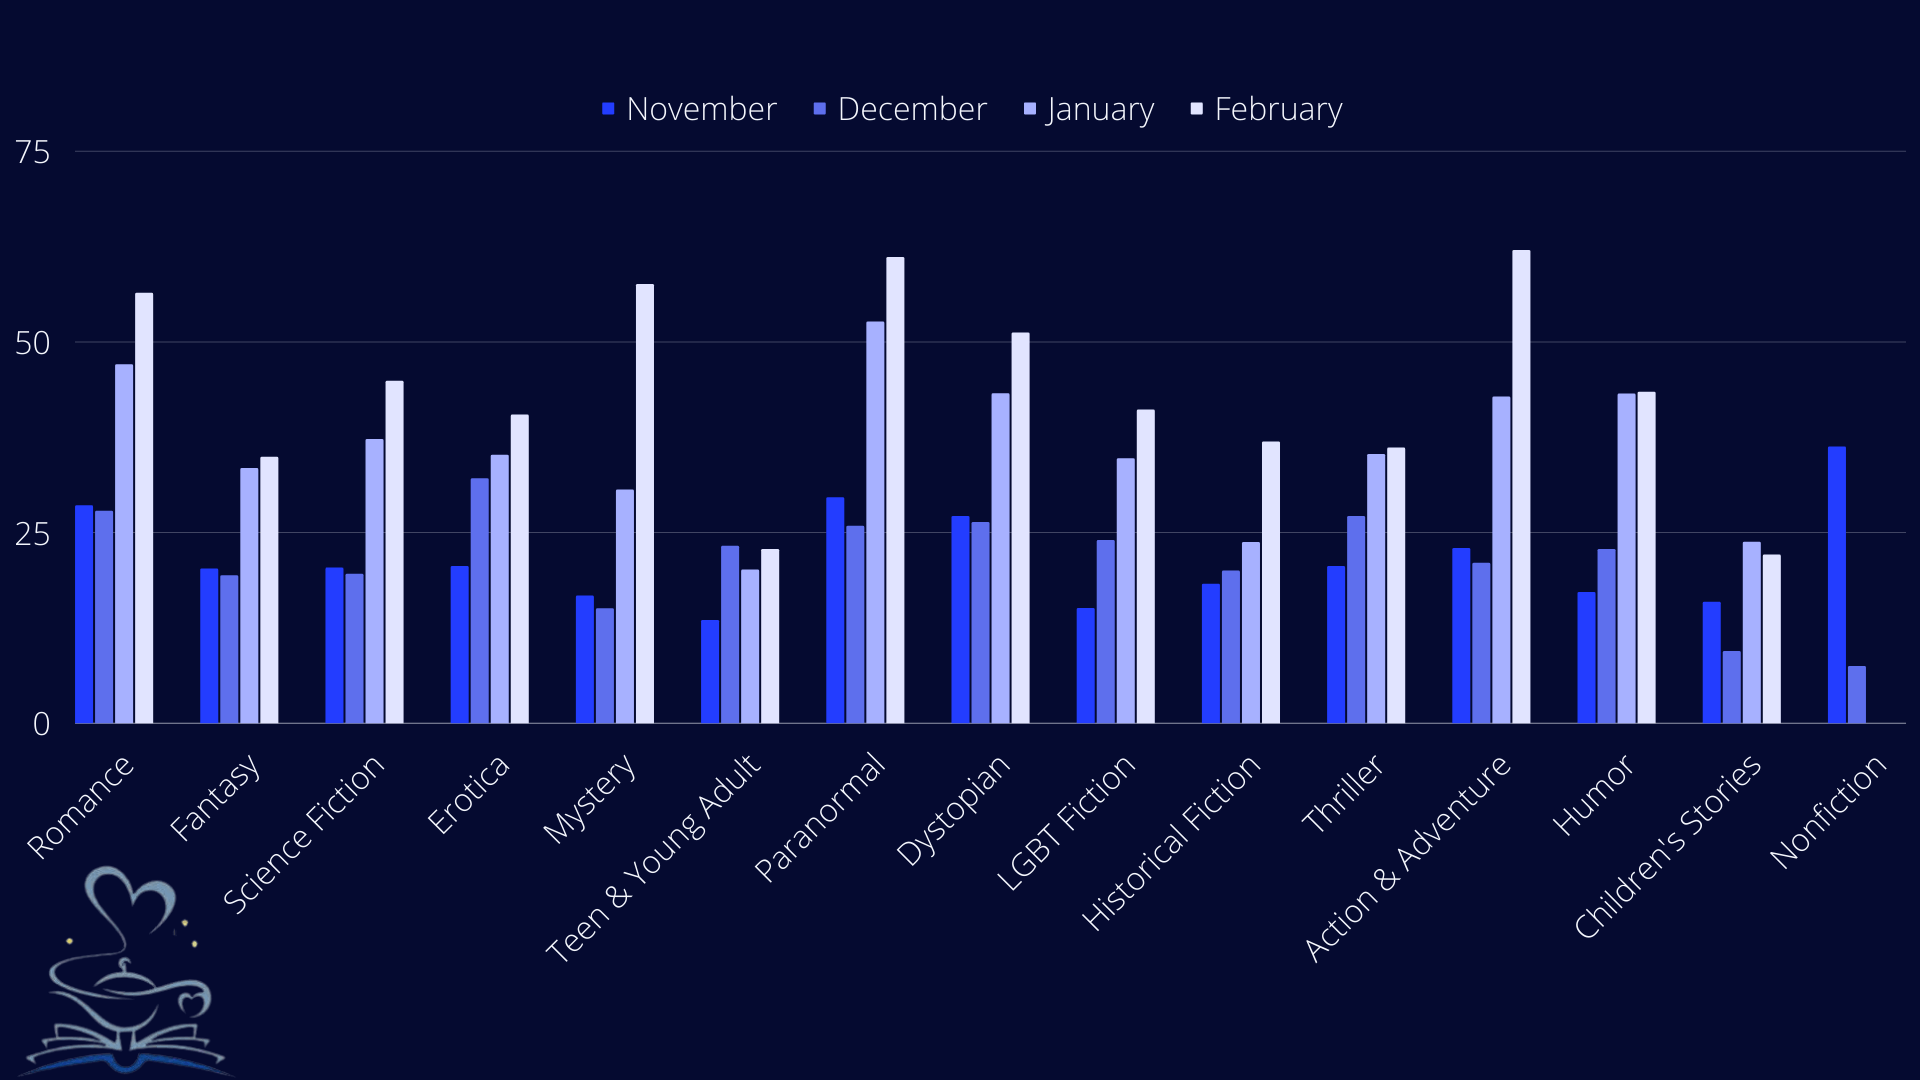
Likes per episode is one method by which authors can evaluate the performance of a series. Authors can use this data to set goals, make projections, and evaluate their series relative to similar series.
In the chart above I have recorded the likes per episode for each series and once again assigned the results to both the primary and secondary genre designations.
While there are many factors that can indicate how a series is performing (unlocked episodes, story follows, etc.) authors can use episode likes to gauge the relative "engagement" of their readers, since likes are a very visible way authors can see that in fact a reader "engaged" with the episode.
While this might be overwhelming news for authors with a small number of overall episodes likes, there is good news. Dividing the likes a series has by its number of published episodes provides an average like per episode. If you compare a 100-episode series to a 10-episode series, a small series may have the same ratio of published episodes to likes.
For example, a series with 100 published episodes and 50 likes has the same "relative engagement" as a series with 10 published episodes and only 5 likes. While the goal of every author is to grow likes and paid episode unlocks, the average number of likes per episode can be a great way to see the performance of your series relative to a series with much larger numbers.
This month I once again have added a comparison to previous months. In so doing we are able to spot growth or decline in engagement by genres.
Average Series Likes - Top 250 Comparison
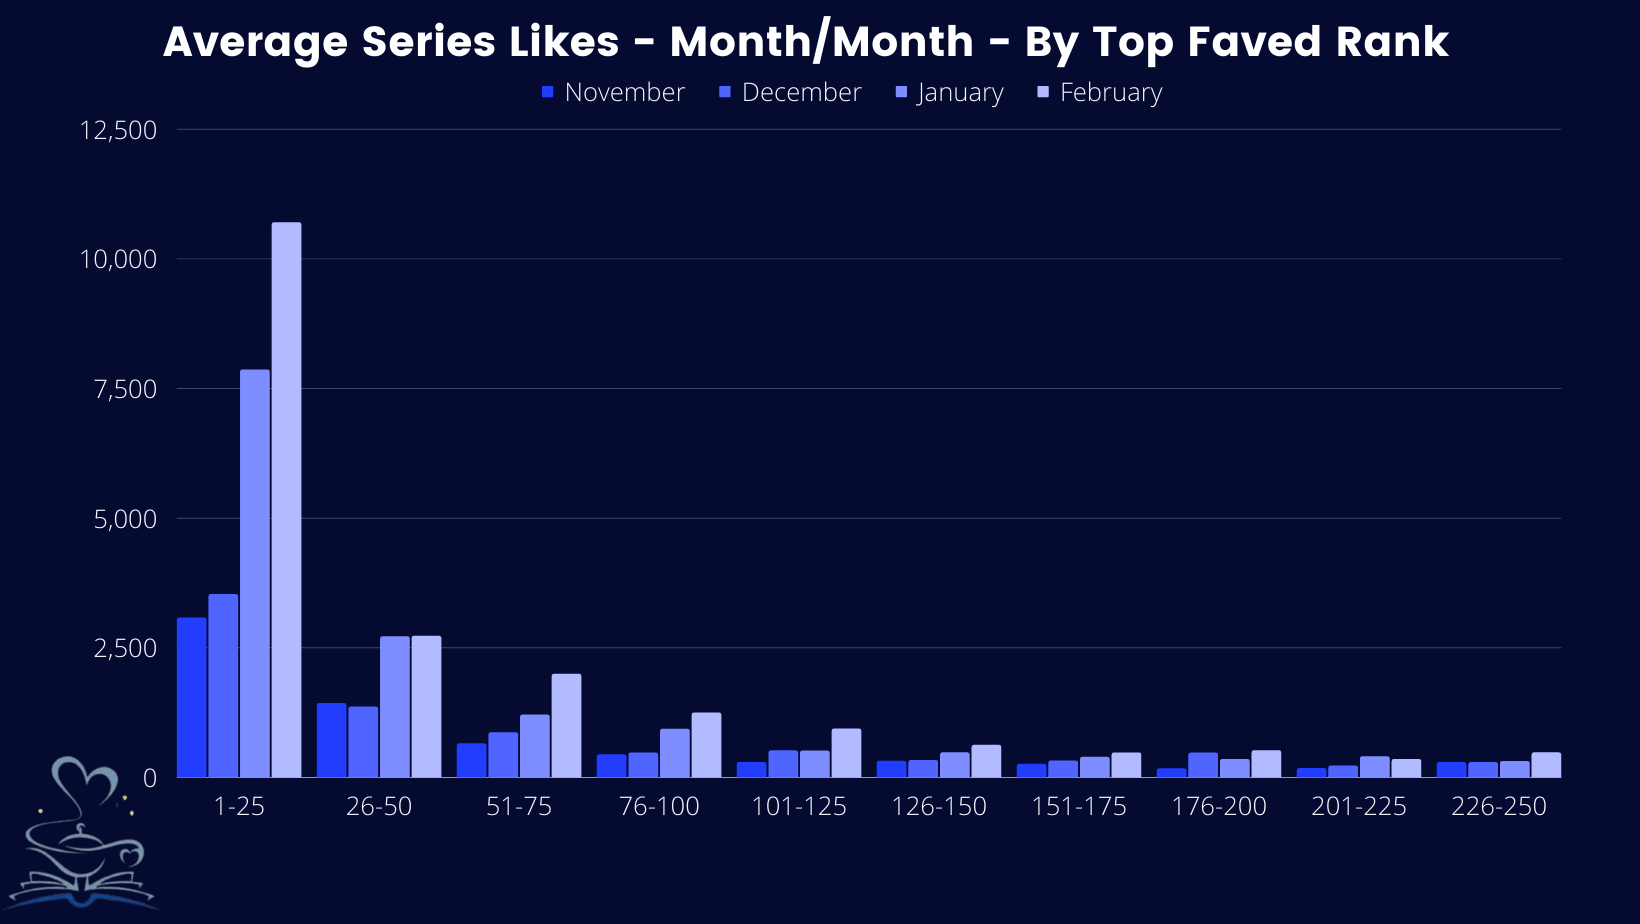
In the next series of charts including the one above, I wanted to compare series ranked on the Top 250 Faved List. For this analysis, I've created an average of the total likes in groups of 25. The reason for this is the current page view on Vella indexes series on the Top 250 List in groups of 25 per page.
The above chart shows the average number of likes each series has accumulated. For comparison the months November through February are listed.
Therefore the series that rank between 1 and 25 on the Top Fave list average 10698 likes per series.
Average Episode Count - Top 250 Comparison
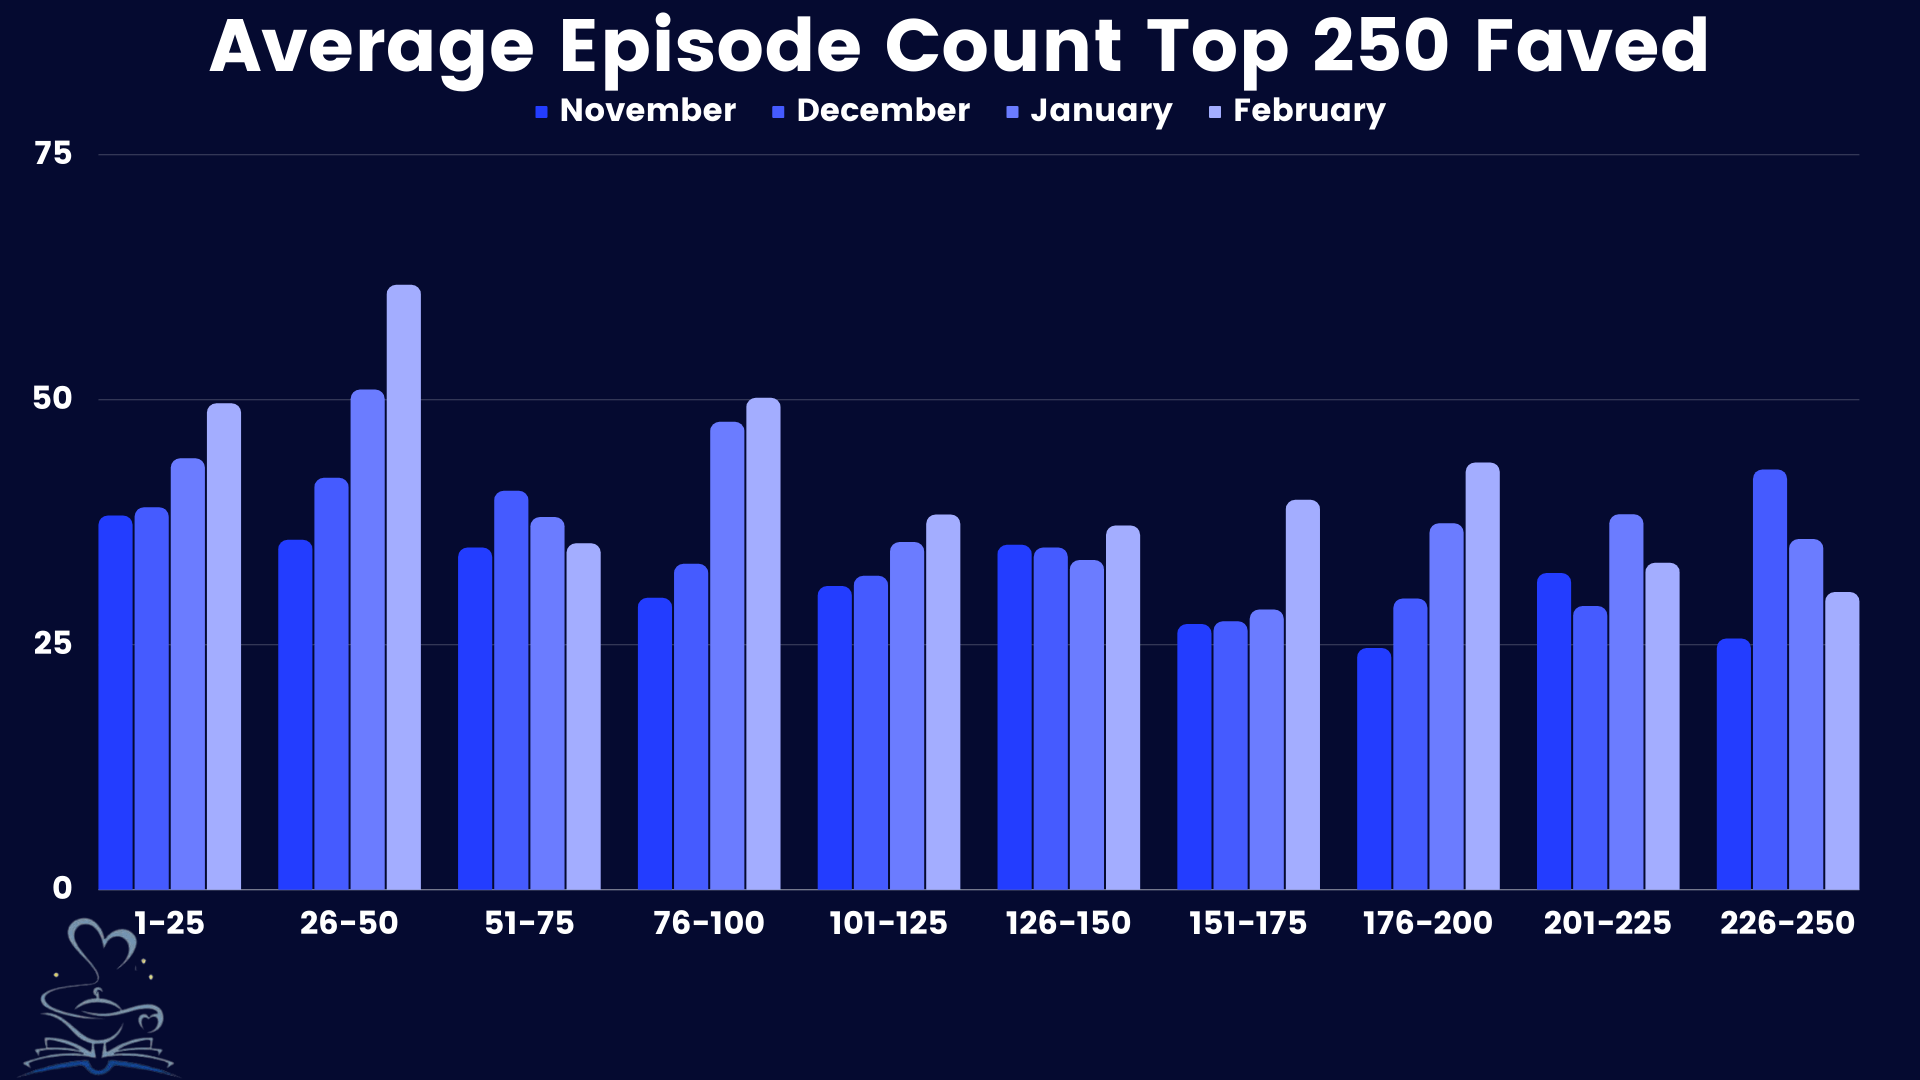
The above chart shows the average number of episodes each series has accumulated for each group (page). For comparison, I’ve shown the results from November through February.
Publishing Frequency Distribution in the Top 250 Faved
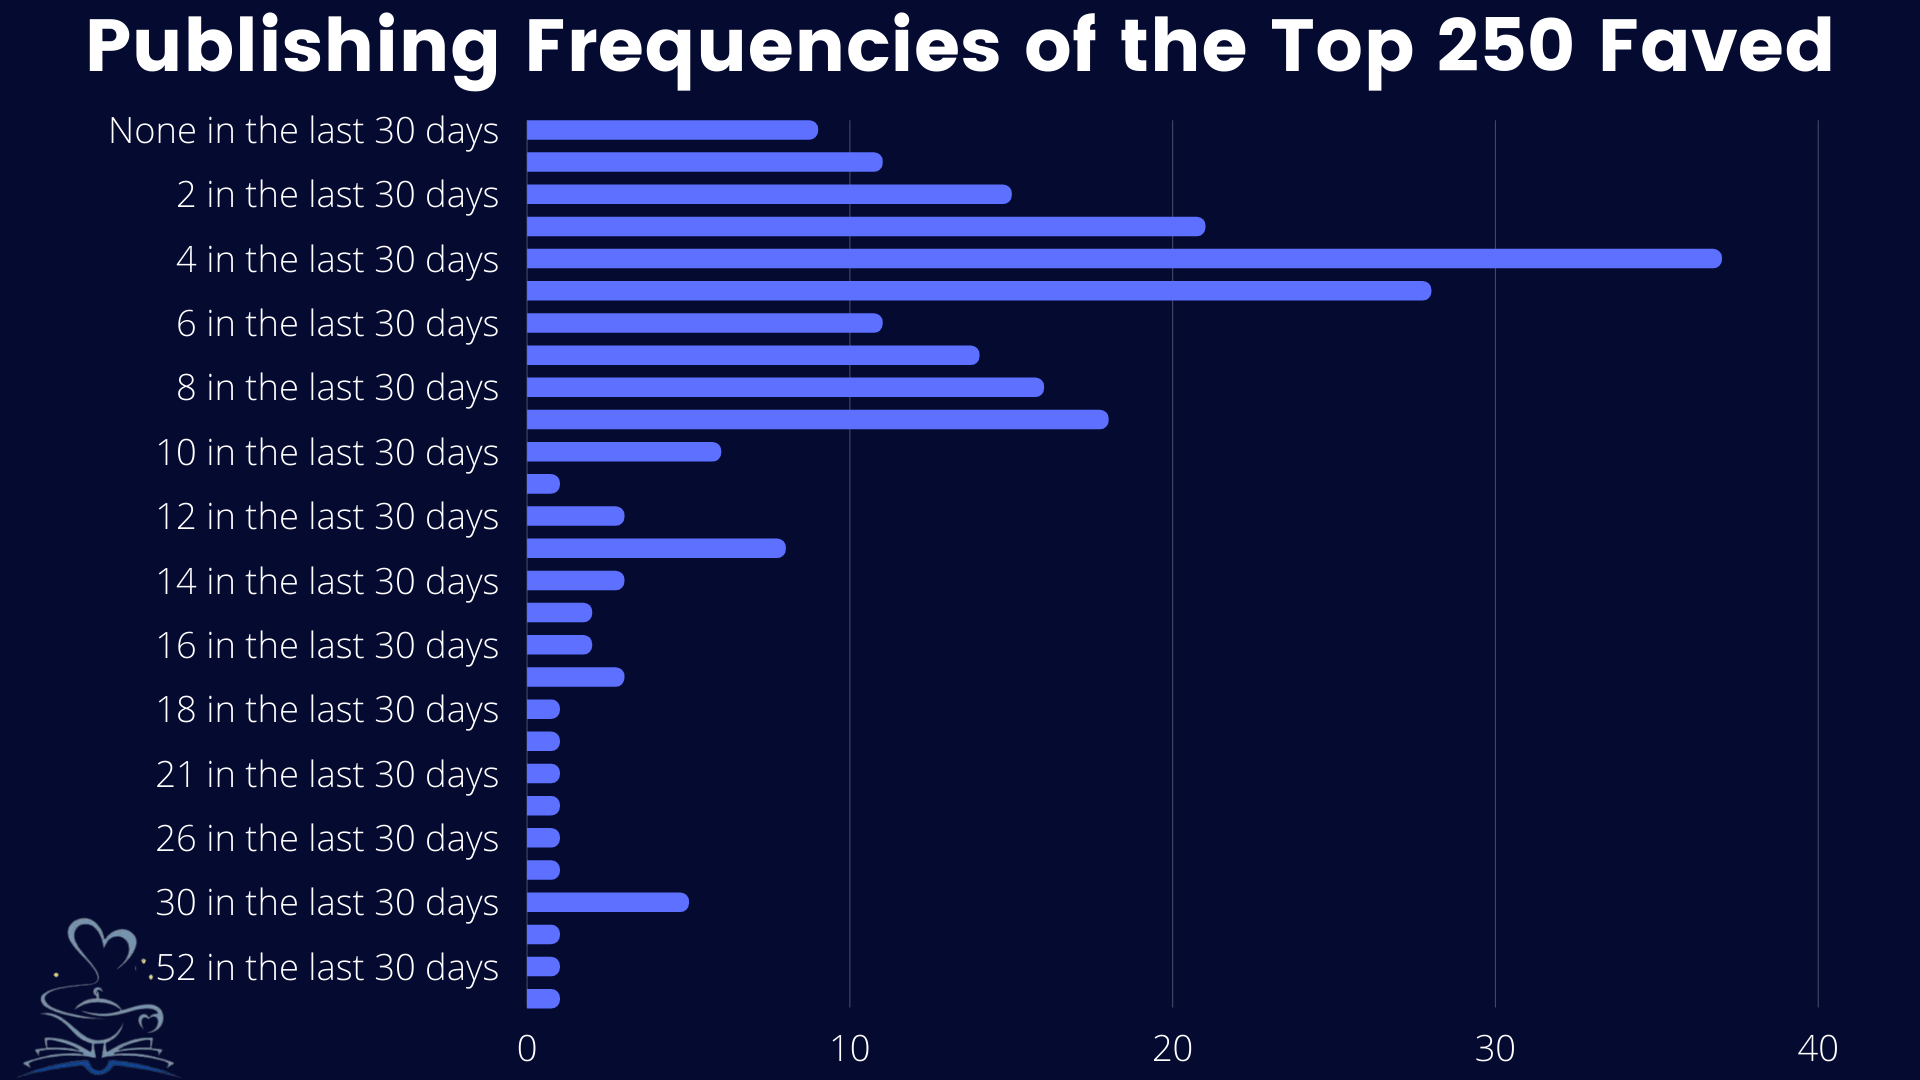
The above chart displays the distribution of publishing frequency in the Top 250 Faved List on Kindle Vella. For this chart, series marked complete were excluded.
Conclusions
Platform Growth Continues at a Slower Pace.
As we can see from the graphs which plot likes per episode, on average series saw an increase in month-on-month engagement per episode regardless of genre. The rate of growth however has slowed down in February compared to January. There are several reasons that this could be the case. However, the burst in reads brought on by the Android/Kindle release in January I believe to be the most likely reason for the slower growth in February.
Higher Positioning = Exponential Engagement?
Observing the series average series likes broken down by page, we can see that series engagement (Likes) exponentially increases the higher up a series appears in the Top 250 Faved List.
Furthermore, the month-on-month change in engagement is exponentially greater for higher-performing series.
It’s possible that the higher the position a series can maintain the greater its engagement on Vella. However, it should also be noted that in order to achieve a higher rank on the Top 250 Faved List a series would need to first increase its series engagement.
Frequently Occurring Genres Have Stayed Relatively Consistent.
Looking at the graph comparing month on month the count of genres on the Top 250 Faved List, we can see that since November the genres represented on the Top 250 Faved List have seen negligible change, which suggests that the most frequently occurring genres on the Top 250 Faved List are likely to remain consistent.