
Kindle Vella Top 250 Faved List Breakdown (December 2021)
The Data
The data logged in this article was manually gathered [January 1st 2022] from the Kindle Vella Top 250 Faved list from information publicly available at the time this article was written. Please be advised the data and insights provided are the opinions of Book Genie. We make no warranty or guarantee regarding the correctness or authenticity of the data, as these are informal calculations gathered via our independent research and is in no way affiliated with or should be construed to represent Amazon, Kindle Vella, or any other Amazon entity.
None of the authors, contributors, administrators, owners, or anyone else connected with Book Genie, in any way whatsoever, can be responsible or liable for your use, reliance, or distribution of the information contained in or linked from these web pages. We respectfully remind readers that we assume no responsibility or liability for any errors or omissions in the content of this data. The information contained here is provided for general informational purposes only on an "as is" basis with no guarantees of completeness, accuracy, usefulness or timeliness. Percentages listed are rounded.
Genre Label Distribution in the Top 250
Series Genre Distribution in the Top 250 Faved List
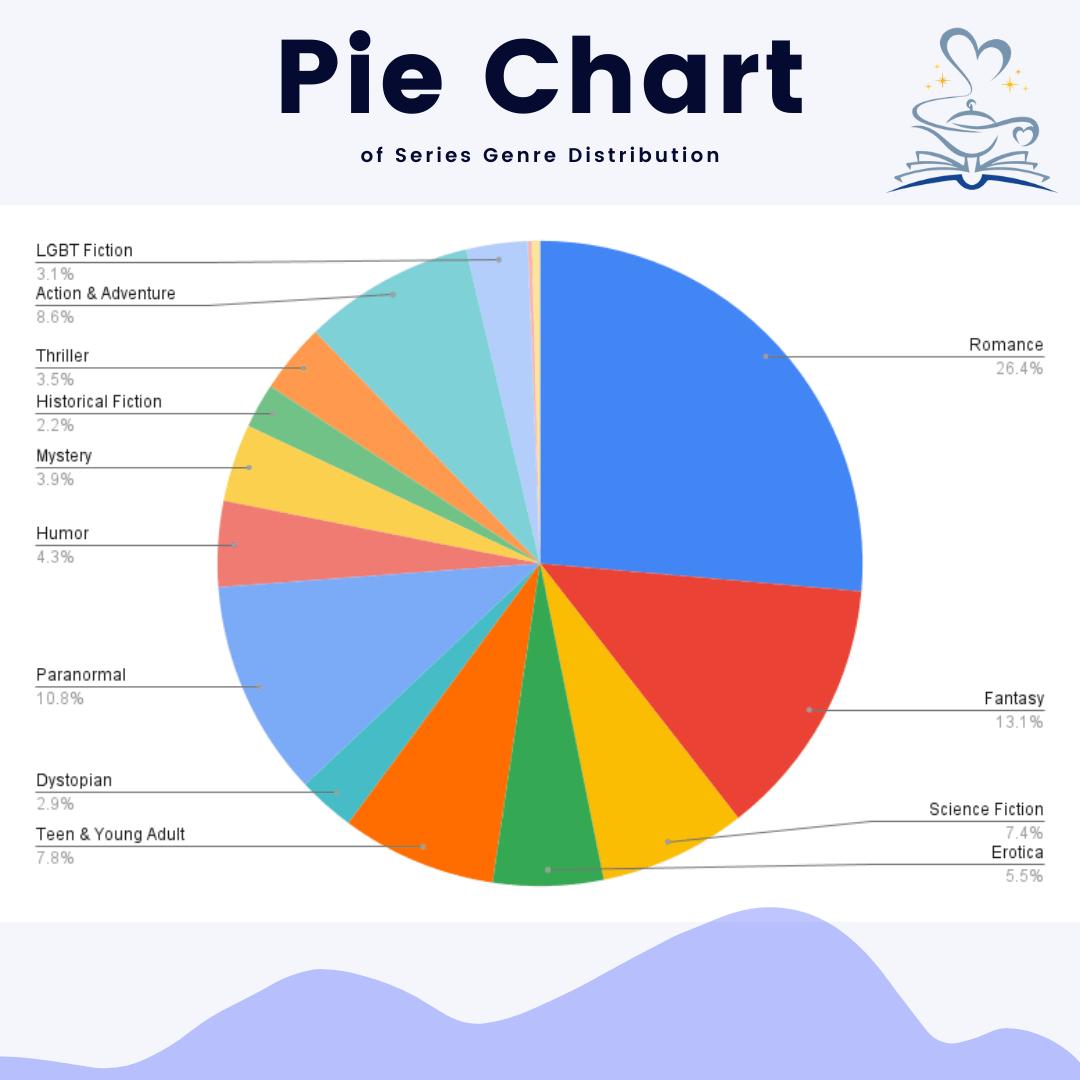
The first chart displays the most frequently occurring genres in the top 250 faved list on Kindle Vella. We determined these numbers by relying on the genre designations (both primary and secondary categories) for each series. For example, if a series is listed as dystopian and paranormal, that series was counted once in dystopian and once in paranormal. The author's story "tags" were not factored into this analysis. In descending order the genres represented on Vella are ranked as follows:
| Genre | Percentage | Change from Prior Month |
|---|---|---|
| Romance | 26.40% | 0.60% |
| Fantasy | 13.10% | 1.30% |
| Paranormal | 10.80% | -0.20% |
| Action & Adventure | 8.60% | 0.30% |
| Science Fiction | 7.40% | -0.20% |
| Teen & Young Adult | 7.80% | 0.80% |
| Humor | 4.30% | -1.30% |
| Erotica | 5.50% | 0.10% |
| Mystery | 3.90% | -0.40% |
| Thriller | 3.50% | -0.60% |
| LGBT Fiction | 3.10% | 0% |
| Dystopian | 2.90% | 0.20% |
| Historical Fiction | 2.20% | 0.10% |
| Nonfiction | 0.40% | 0% |
Distribution of Total Episode Likes per Genre in the Top 250 Faved List
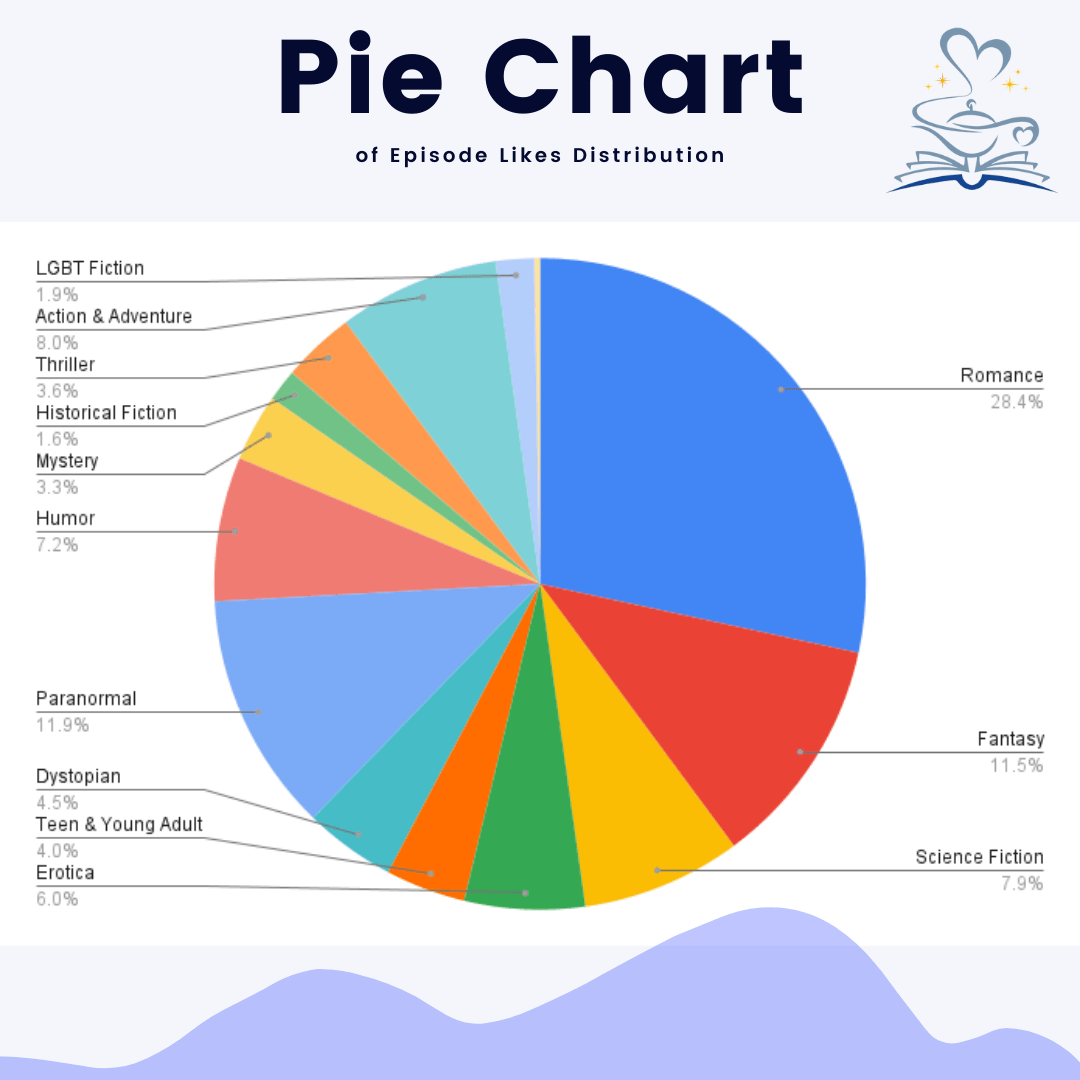
This chart displays the distribution of episode likes attributed to each genre. As in the previous chart, each episode "like" has been counted twice: once in the primary genre (category) designation for the series and once for the secondary (category) genre designation of the series.
For series with only one genre designation, the likes were attributed only to that single genre. This graph, in comparison to the previous, allows us to draw some insights into the engagement levels for each genre.
For example, in the first chart, Paranormal ranked as the third highest occurring genre designation on the Top Fave leaderboard, following Romance and Fantasy. However, when we compare total likes, we can see that Paranormal series earned more likes than Fantasy series (again for those series ranked on the Top 250 list).
Romance series earned the greatest number of likes per episode, which makes sense since the largest number of series on the Top 250 list are categorized as romance.
Distribution of Volume of Episodes Published per Genre in the Top 250 Faved List
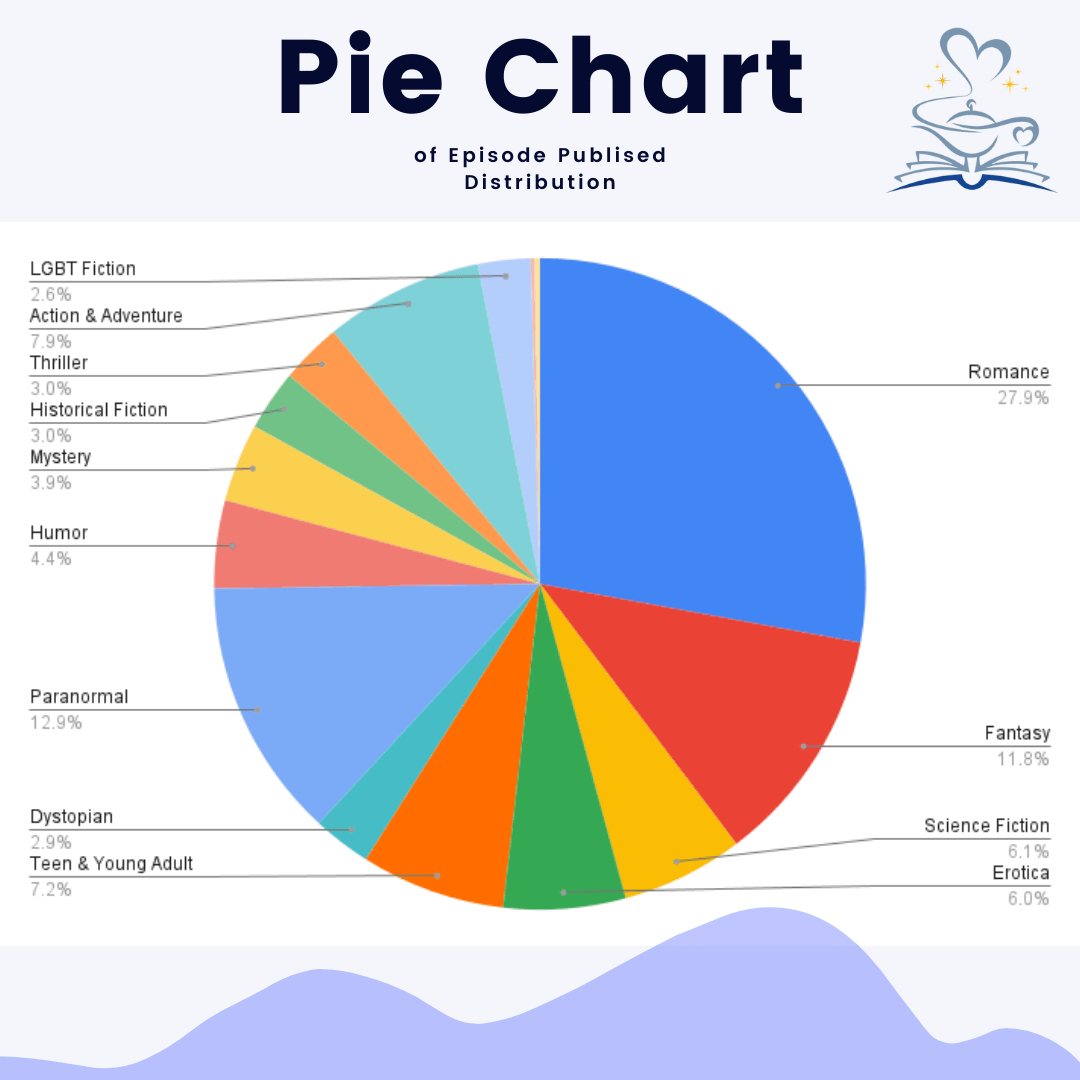
This third chart shows the relative volume of episodes published by genre for series that ranked on the top 250 Fave List (grouped again by genre designation for both primary and secondary genres). This is an inclusive roundup, meaning that all episodes available for purchase by readers in November 2021 were counted, regardless of when they were published by the author. As you can see, the genres with the highest representation on the Top 250 Fave List (Romance, Fantasy, and Paranormal) are also the genres with the highest relative rate of published episodes.
Average Likes per Episode by Genre in the Top 250 Faved List
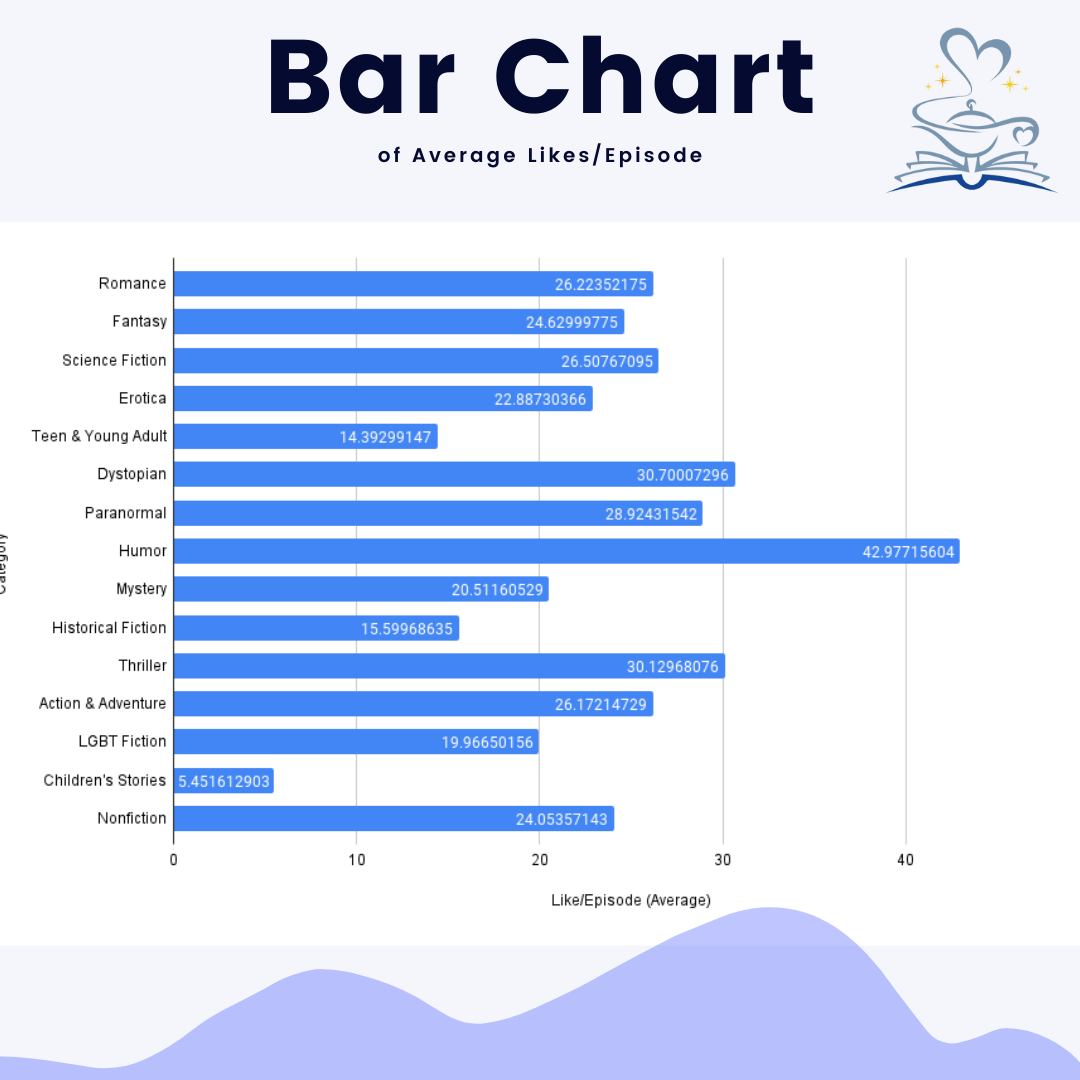
Likes per episode is one method by which authors can evaluate the performance of a series. Authors can use this data to set goals, make projections, and to evaluate their series relative to similar series.
In the chart above I have recorded the likes per episode for each series and once again assigned the results to both the primary and secondary genre designations.
While there are many factors that can indicate how a series is performing (unlocked episodes, story follows, etc.) authors can use episode likes to gauge the relative "engagement" of their readers, since likes are a very visible way authors can see that in fact a reader "engaged" with the episode.
While this might be overwhelming news for authors with small overall episodes likes, there is good news. Dividing the likes a series has by its number of published episodes provides an average like per episode. If you compare a 100 episode series to a 10 episode series, a small series may have the same ratio of published episodes to likes.
For example, a series with 100 published episodes and 50 likes has the same "relative engagement" as a series with 10 published episodes and only 5 likes. While the goal of every author is to grow likes and paid episode unlocks, the average number of likes per episode can be a great way to see the performance of your series relative to a series with much larger numbers.
December 2021 saw a rise in the engagement per episode for series categorized as humor substantially ahead of other genres.
Genre Combinations in the Top 250
Most Frequently Occurring Genre Combinations in the Top 250 Faved List
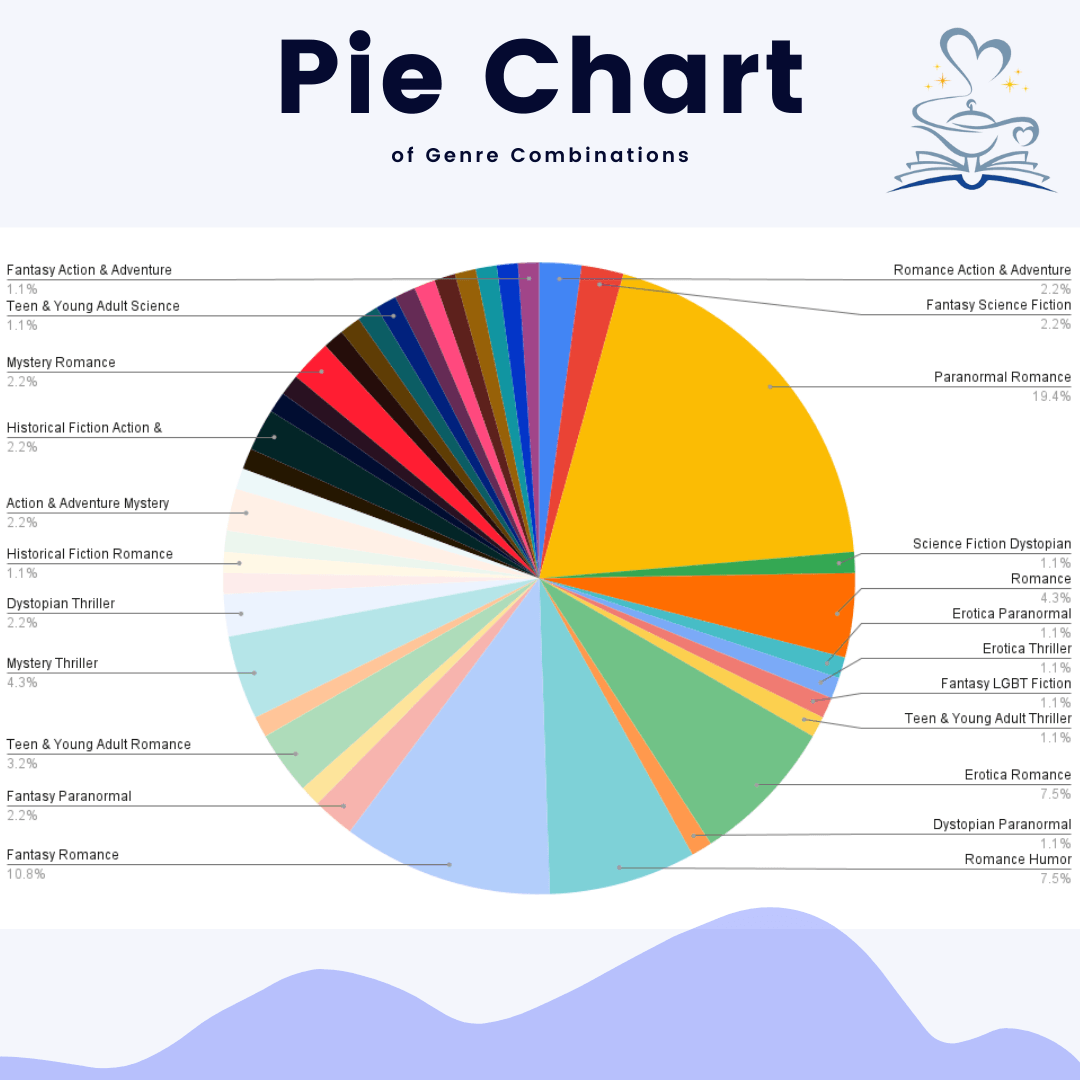
The above chart displays another way to look at the genre designations for the series on the Top 250 Fave List. In the previous charts, each story was given two scores, one for each genre designation. The chart above combines the two genre categories for each of the Top 250 series into one "designated genre combination."
What that means is that instead of a dystopian paranormal series being counted once in dystopian and once in paranormal, we counted the series as "dystopian paranormal." In so doing, we compare not only the two genre designations per series, but the overall genre pairings used in the top 250 faved list on Kindle Vella. For clarification, the genres Paranormal/Romance and Romance/Paranormal are labeled under one group: Paranormal Romance.
Accordingly, the top two most frequently occurring combinations are as follows:
Paranormal/Romance (19.4%) Fantasty/Romance (10.8%)
The Top 250 Compared by Rank
Average Series Likes for Series on the Top 250 List
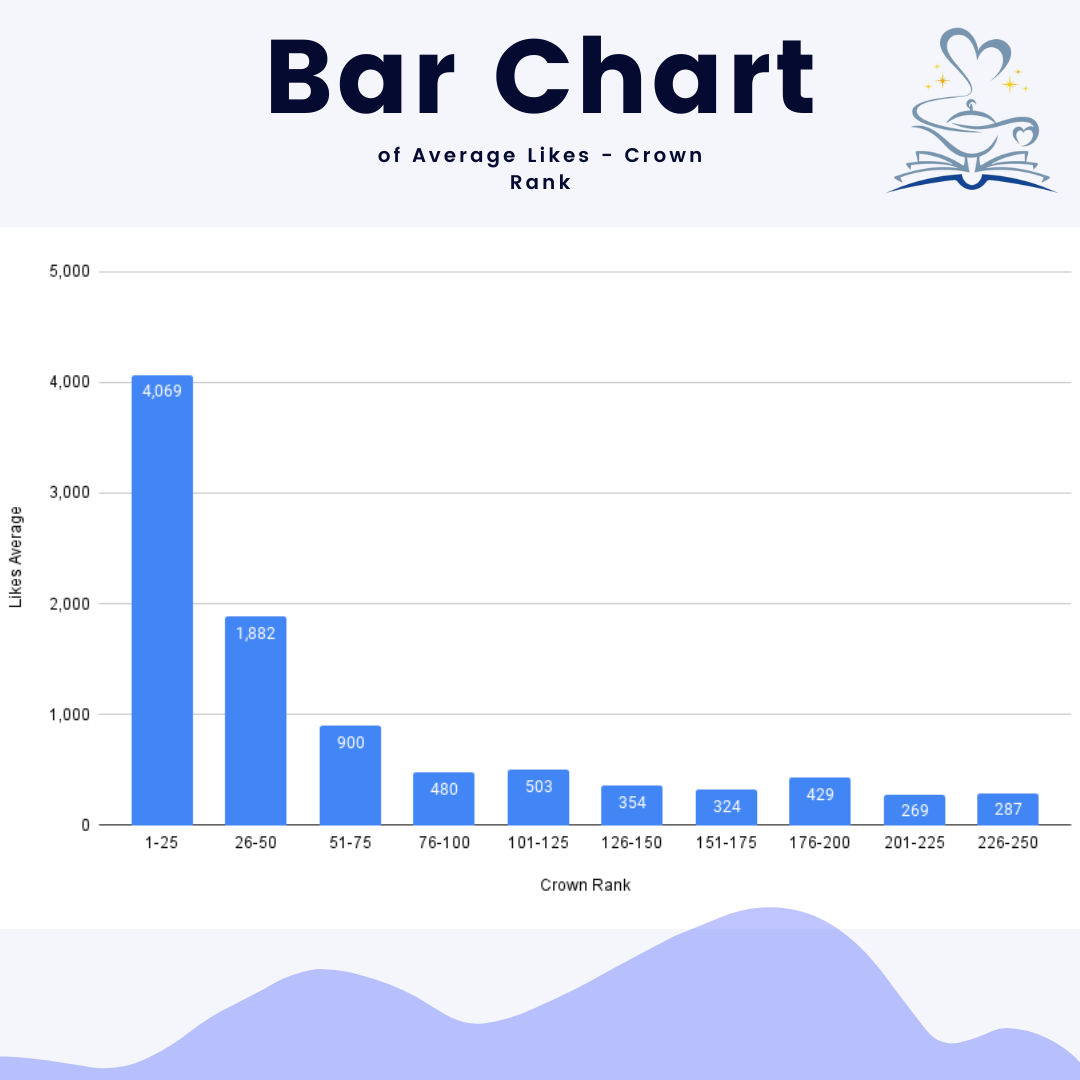
In the next series of charts including the one above I wanted to compare series in the top 250 List. For this analysis, I've created an average of the total likes in groups of 25. The reason for this is the current page view on Vella indexes series on the Top 250 List in groups of 25 per page.
The above chart shows the average number of likes each series has accumulated over the total numbers of published episodes for each group (page). So the series that rank between 1 and 25 on the Top Fave list average 4069 likes per series.
Average Number of Published Episodes of a Series by Rank on the 250 Top Fave List
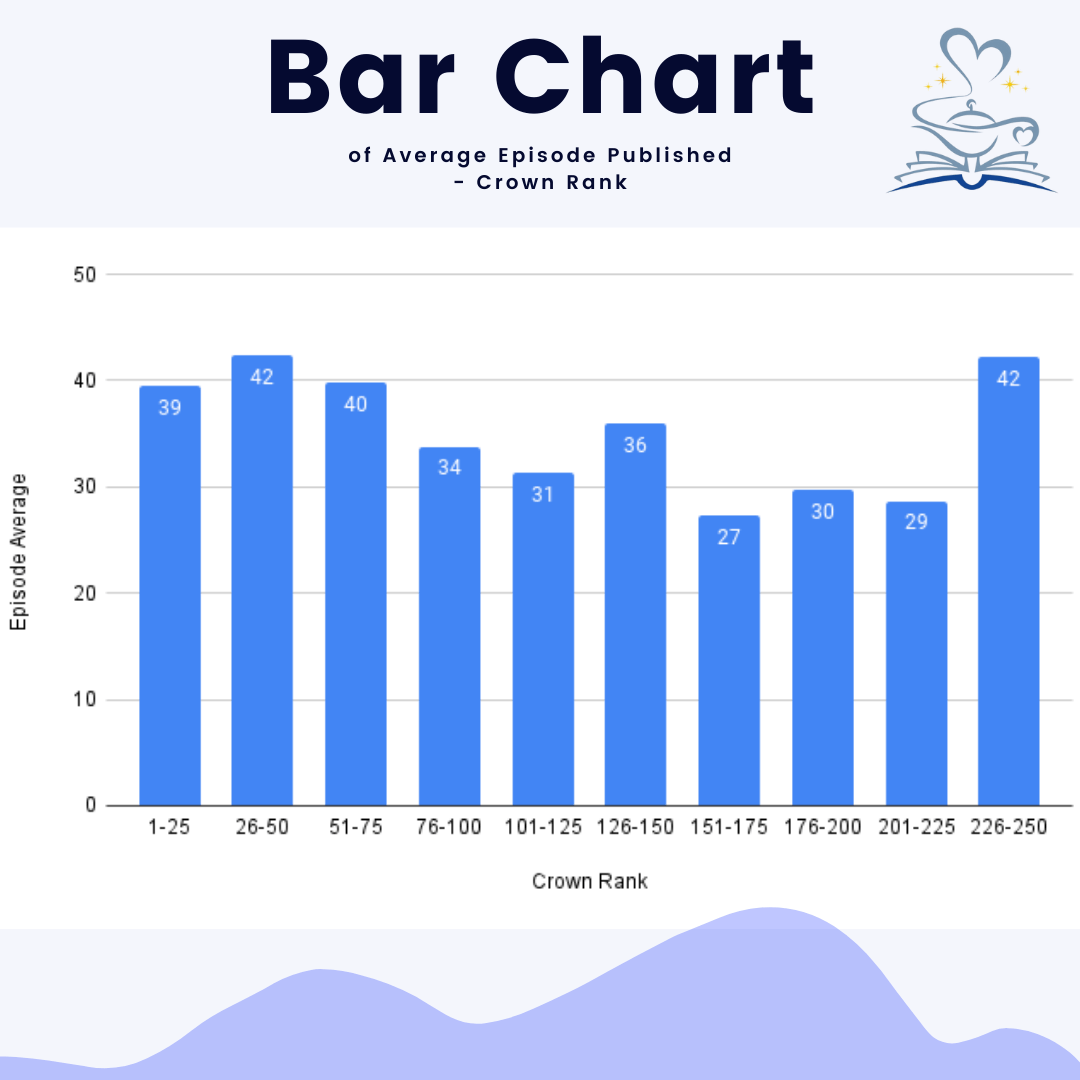
The chart above looks at each series by its rank in the top 250 Faved List group by 25 (the per page view on the Fave List). This chart reflects the average number of published episodes per series, so series that rank between 1-25 on the Fave List average as of month-end December 2021, 39 published episodes and so on.
Average Likes per Episode of a Series by Rank on Top 250 List
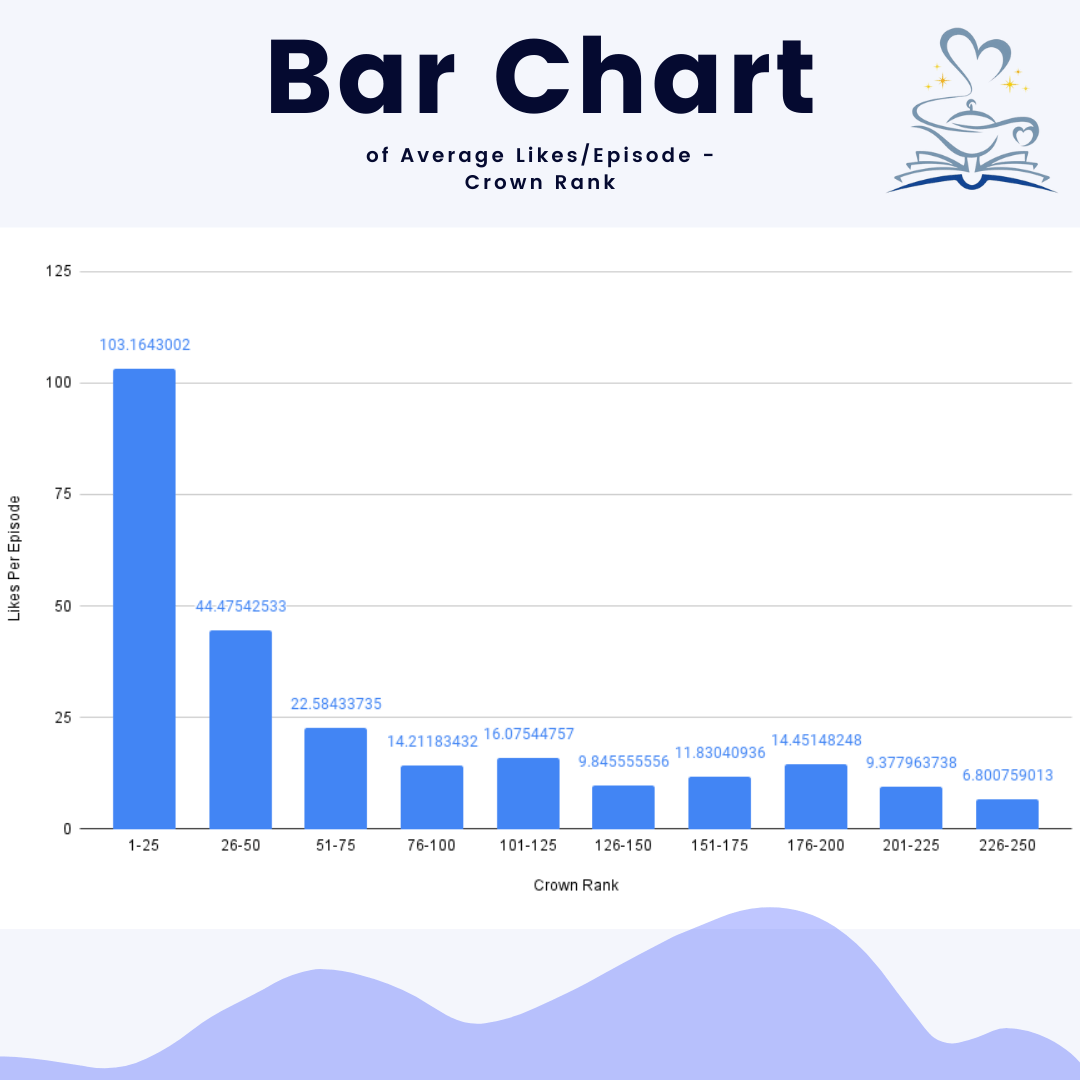
The final chart in this series groups series by their position on the top 250 Fave List again per page view, 1-25, 26-50, and so on. This chart provides the average number of likes that an episode has received for series per page view, 1-25, 26-50, and so on. So for example, series that rank between 1-25 on the Fave List averaged 103 likes per episode.
Conclusions
- Individual genres (e.g. Paranormal as opposed to Paranormal Romance) on the whole saw little change to the chances that they’d occur on the top 250 list.
- The Paranormal Romance combination saw huge growth in occurrence within the top 250 list. An increase from 11.2% to 19.4% meaning that almost 1 in every 5 of series on the top 250 list was categorized as Paranormal Romance.
- The average likes per episode of a top-performing series as judged by its position on the top 250 list has increased from the previous month (November) with ranks 1-25 on average increasing their likes per episode by 25%. What I would take from this is that series which have finished in the top 25 position this month saw on average a 25% increase in engagement/the number of accumulated likes. What this may also mean is that the volume of new readers coming to the platform is increasing.